
AI can (finally!) create high-quality maths diagrams
Party time in the Barton household

WARNING: This post gets very geeky. If you have come here for the free resources, I have built a brand-new topics page on my Mr Barton Maths, which includes my latest attempt to build resources for diagram-heavy topics such as angle facts, Pythagoras, and pie charts. I hope you find it useful.
Right. That lot have gone. Just my fellow nerds left. Let’s dig in.
AI’s Achilles heel
For the last couple of years, AI has been brilliant at producing maths resources for Number and Algebra topics. Worksheets on column addition, sets of equations to solve, exercises on simplifying surds — all of it churned out in seconds and most of it usable.
But the second you asked it to draw a diagram, things fell apart.
Triangles with angles that did not add up to 180. Pie charts where the segments overlapped. Bar charts where the bars hovered above the axis. Scatter graphs that looked like my 4-year-old had attacked the page with a biro.
I was over-optimistic about this early on. After a lot of faffing, you could just about coax one decent-looking diagram out of the model.
But as soon as you tried to change anything — say, generate ten of them with the angles varied — things would inevitably break.
I was on the verge of giving up. If you look back at my bundles of resources — things like Super 8s — they are pretty well populated for all the Number and Algebra topics. But Geometry and a lot of Statistics? Sparse. And it was not for want of trying.
Then Opus 4.7 dropped
As we know, the world of AI moves very fast.
A couple of months ago, Anthropic — the company behind Claude — released their latest frontier model. It is called Opus 4.7. And because I am a massive geek these days, I get as excited when a new model comes out as I used to do when a new Oasis album came out back in the day.
So as soon as it was released, I set aside three hours, told my wife I'd be busy, and started messing about with it.
One of the first things I tried was diagrams. And immediately I noticed something had changed.
When I asked it to draw geometry problems involving angles, it was nailing them first time. And — crucially for me — it could generalise. Generate ten of them, vary the angles, change the orientation, all of them correct.
Here is the first prompt I used (Note: I now use Wispr Flow to dictate prompts instead of typing them, hence the unstructured nature of this one - it saves me so much time versus typing prompts, and for this kind of interaction, I think the results are better as my thoughts are more free-flowing)
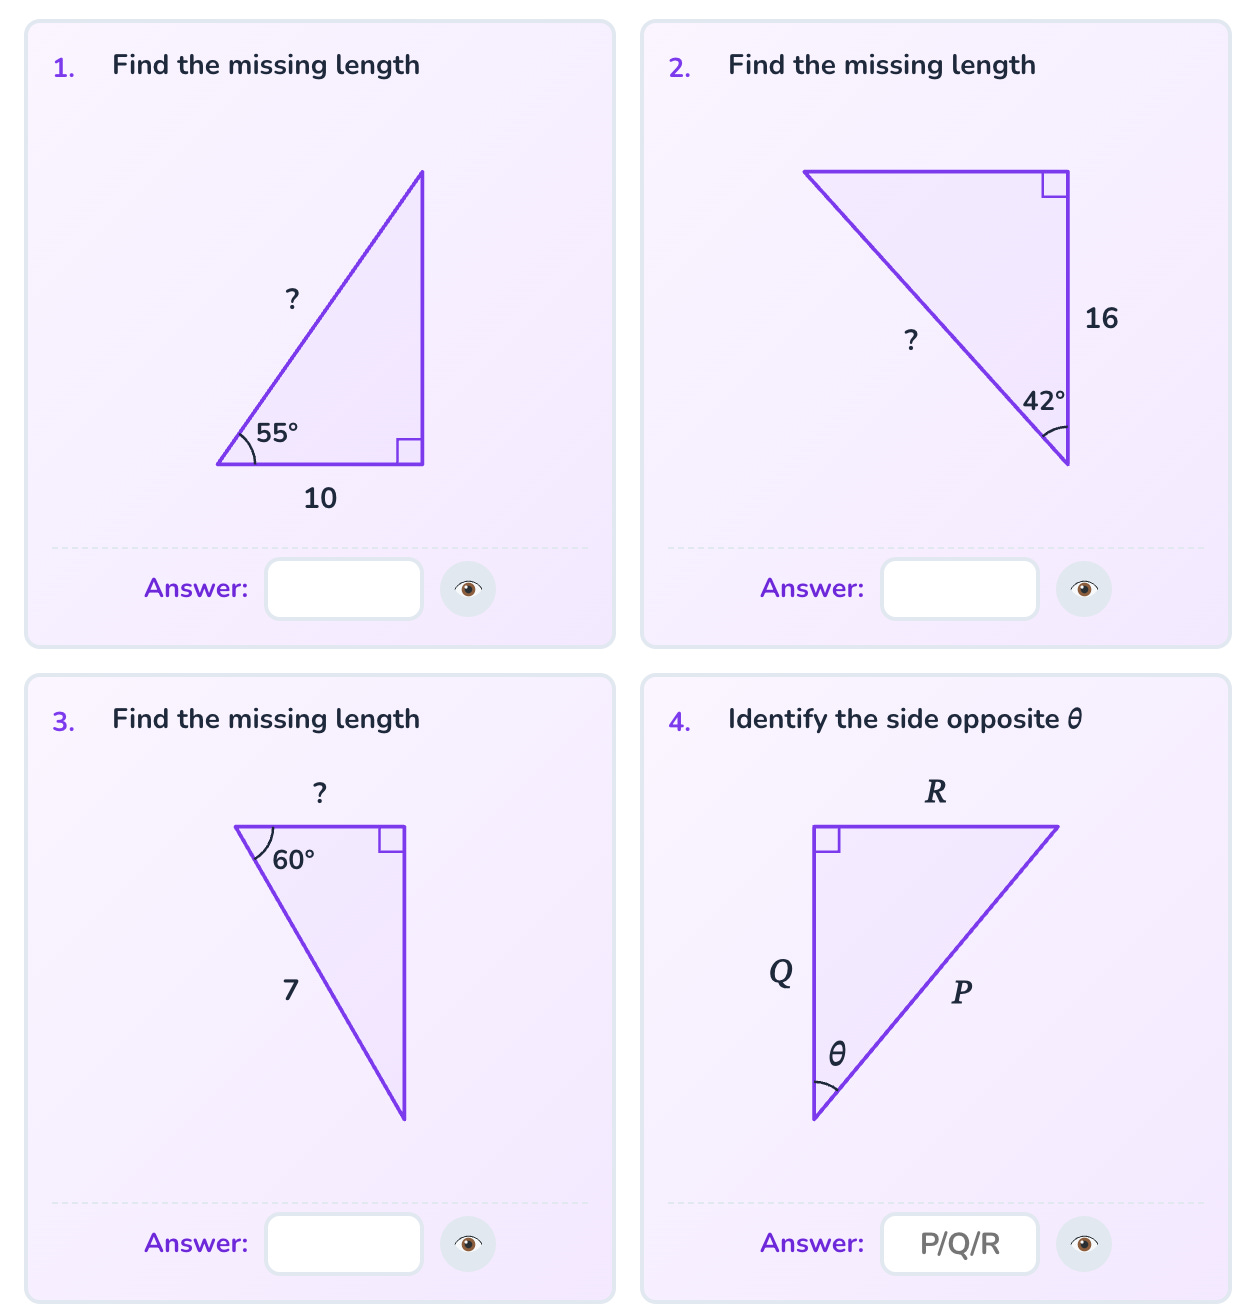
OK Claude, here comes the biggest challenge for a Shedloads of Practise page yet. We are going to build one on Pythagoras and right-angled trigonometry. I know exactly the types of questions I want to ask, but the challenge is we are going to need images. I will describe the topics and then I’ll talk through what I want the images to look like.
I want some prerequisite skills on identifying the relevant sides of triangles.
Identify the hypotenuse when you’re given all three sides.
Identify the hypotenuse when you’re given an angle and all three sides.
Identify the adjacent when you’ve got an angle and all three sides.
Identify the opposite when you’ve got an angle and all three sides.
Then we come into the calculation skills. For Pythagoras, there would be two:
Calculate the hypotenuse. For those questions, you’d be given two sides, and you’d have to work out what the hypotenuse is.
Calculate one of the shorter sides. That’d be the second skill, and there you’re given the hypotenuse and one of the shorter sides, and you’ve got to work out one of the other sides.
For the trigonometry section, there would be three for sine, three for cos, and three for tan. For sine, it would be:
Calculate the opposite
Calculate the hypotenuse.
Calculate the angle.
Then do equivalent categories for cos and tan.
The question topic splits itself up really nicely, but the challenge comes with the diagrams. A few things about these:
They all need to be right-angled triangles.
I would like to use integer lengths for all the given lengths, and all answers that come out to be non-integers, which will be the vast majority of them, round to one decimal place.
I would like the right-angled triangles to be presented in four different orientations:
Right-angled bottom left.
Right-angled bottom right.
Right-angled top right.
Right-angled top left.
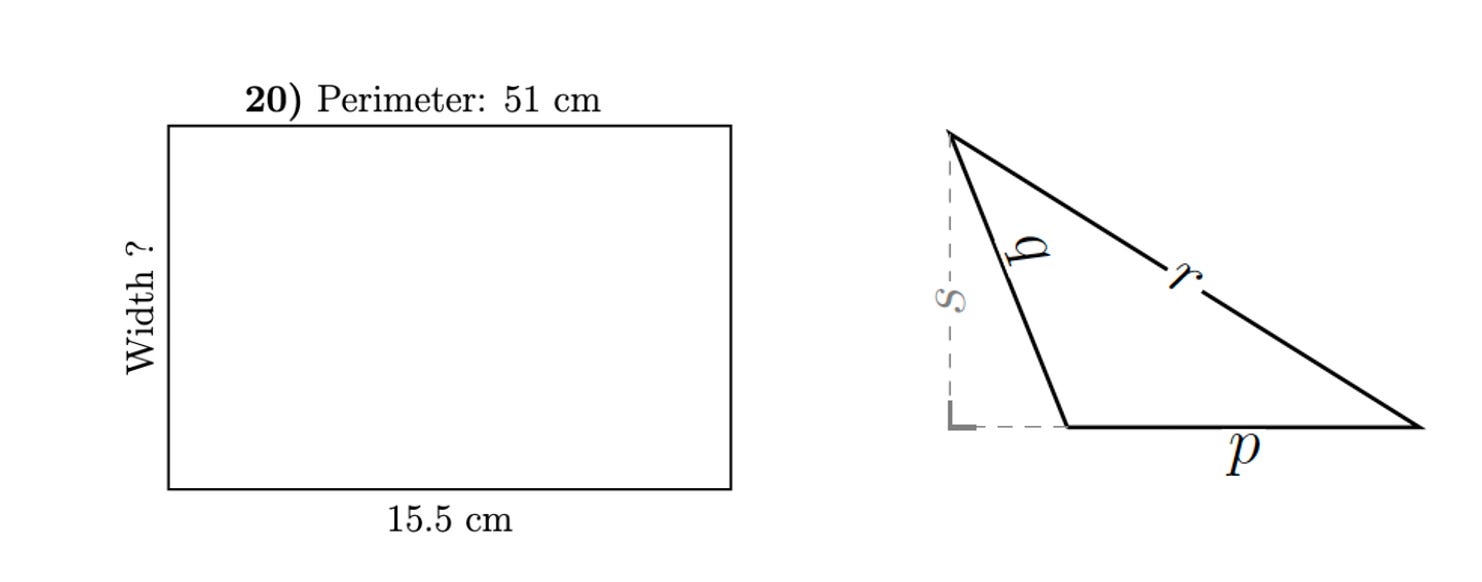
I would like the sides roughly proportional. Certainly, I don’t want any sides that are labelled less than another side to appear longer than that side. Also, I don’t want anything like where one side labelled two and another side is labelled nine, and they look roughly the same length. This is going to be a challenge. Those are my initial thoughts. How can we do this?
And here is what came back:
This got me very excited.
So I tried a load more
Next up, I had a go at other Geometry topics.
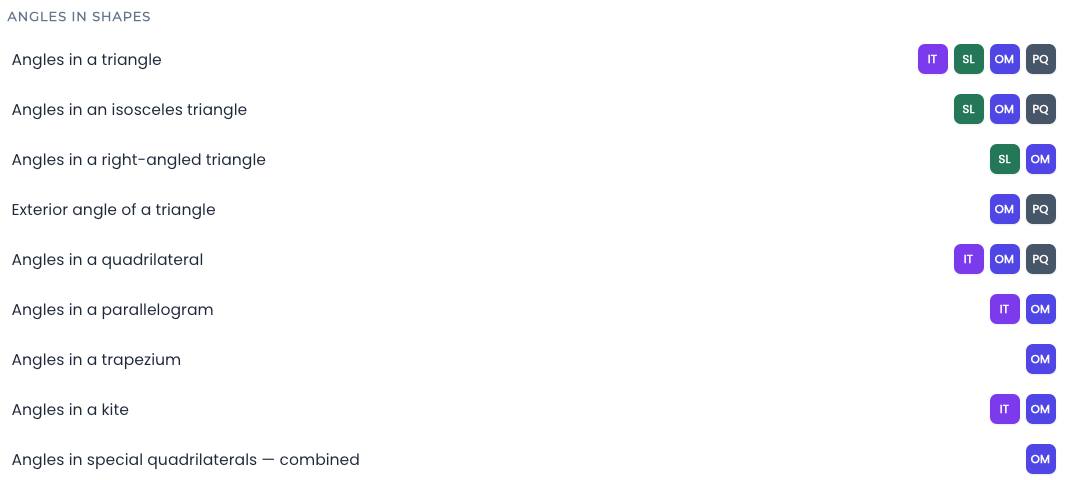
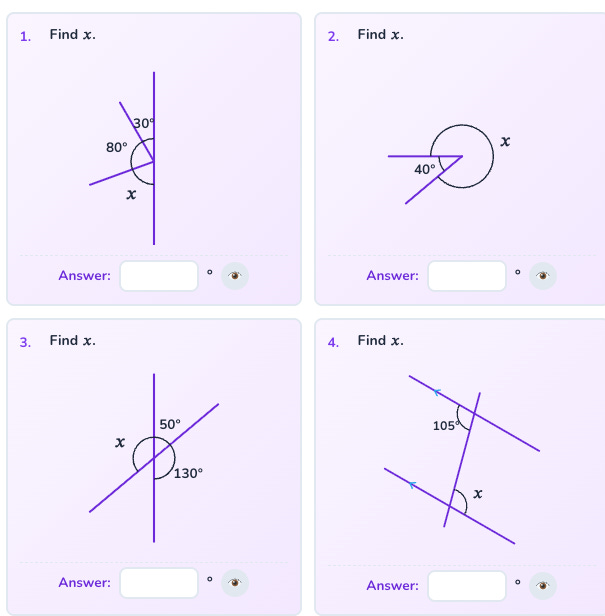
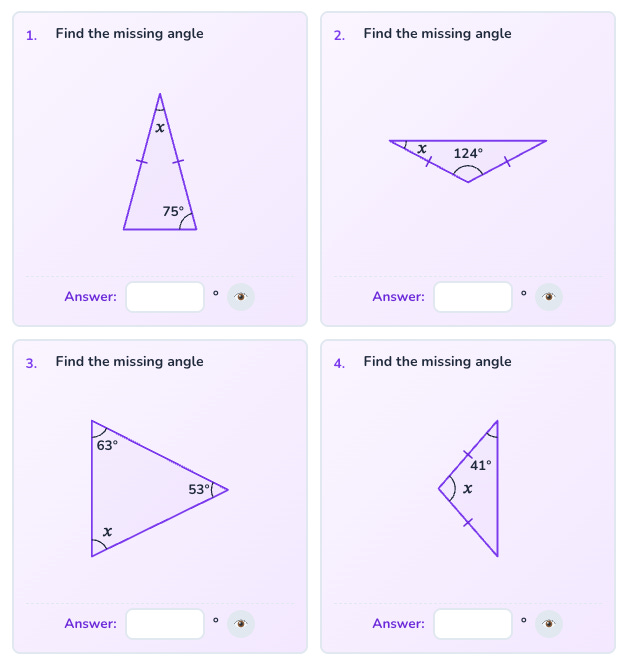
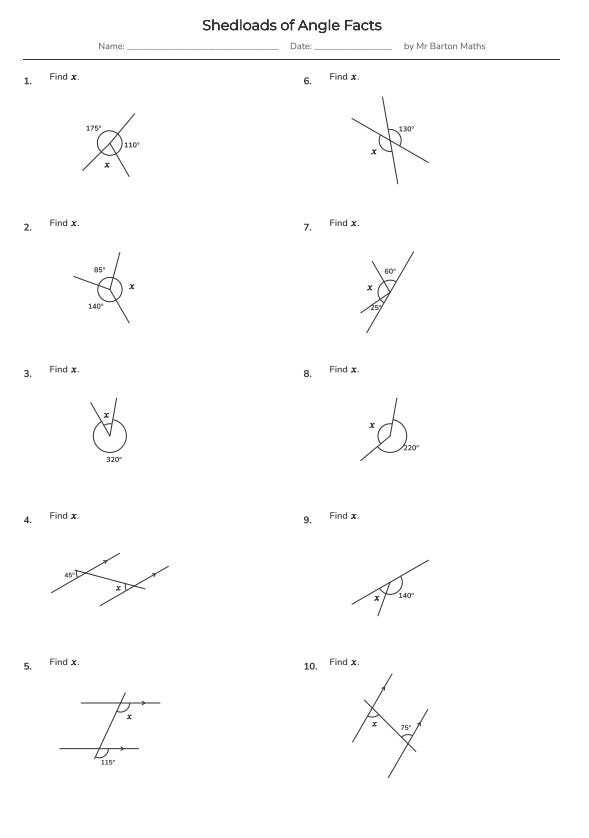
Angle facts:
Angles in a triangle:
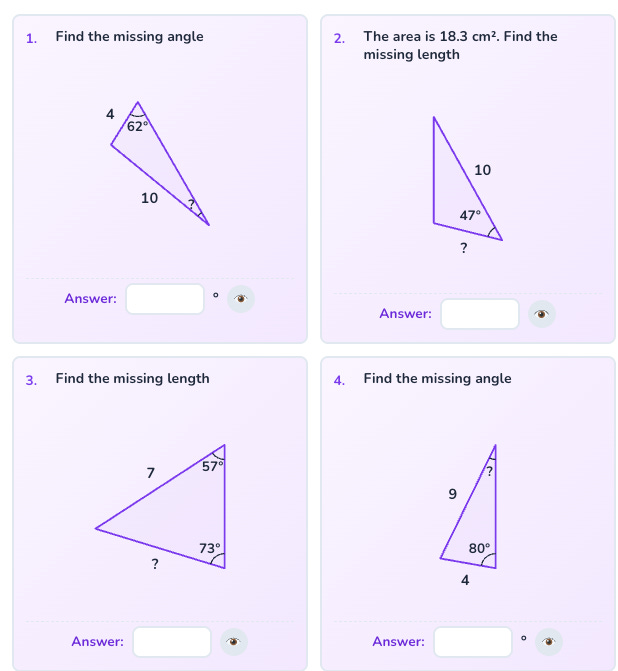
Further trigonometry:
Again, I was impressed.
Then I thought: whilst we’re on a roll, let’s try statistical diagrams.
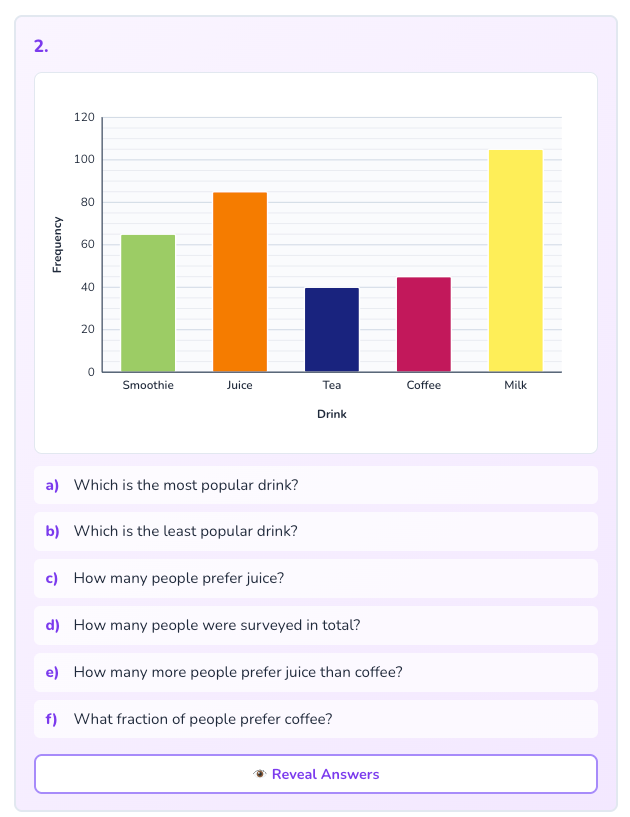
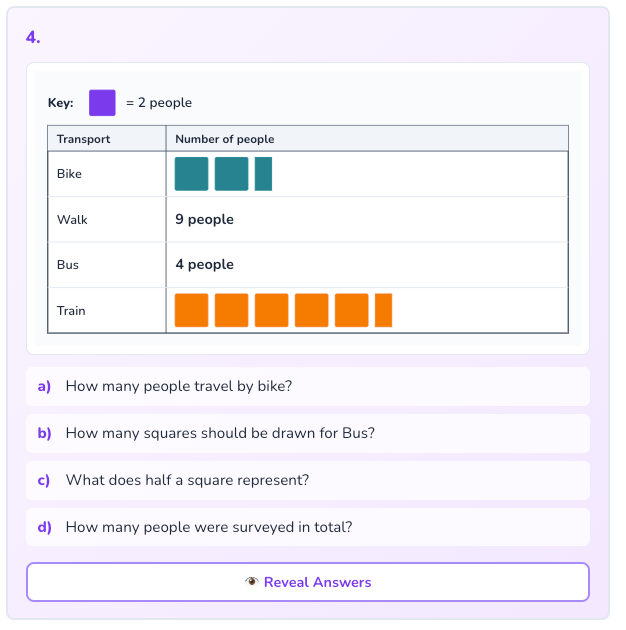
Bar charts:
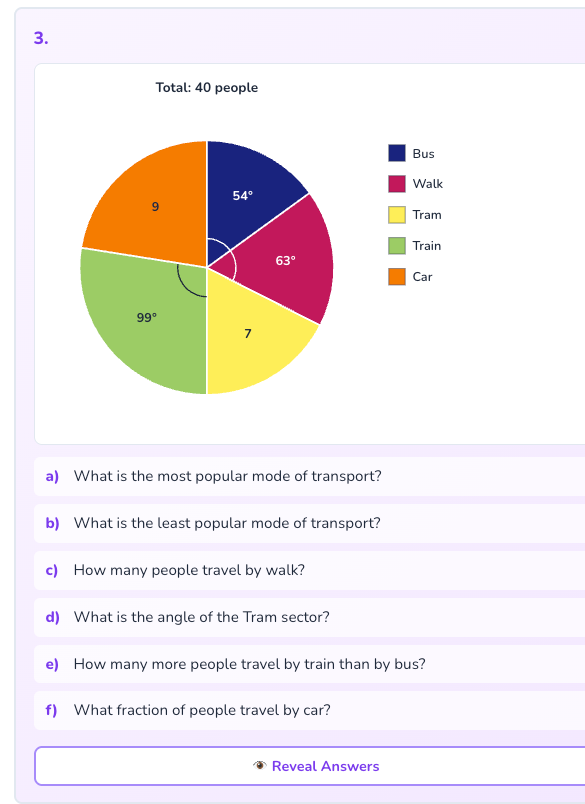
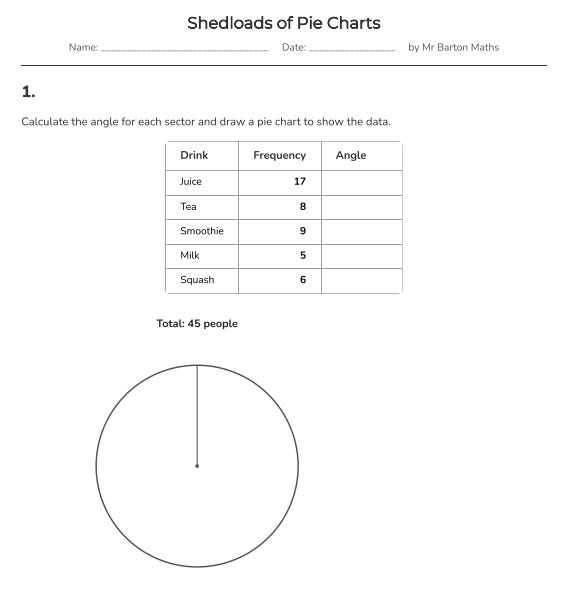
Pie charts:
Pictograms:
Each of these took no more than two back and forths to get looking like this
Why this matters
From my perspective, there are a couple of things that are nice about this.
Application 1: Bespoke resources for any topic
First, you can generate as many of these as you want, selecting the exact question type you want. Want a problem set with 10 questions just on angles on a straight line? Click. 20 questions, including all three parallel line angle facts? Click. 40 questions on angles in isosceles triangles? Click.
I have also managed to get Claude to lay these out as proper worksheets. Sensibly scaled diagrams. Space for students to write their answers. Everything fitting on a single A4 page. The kind of worksheet that, six months ago, I would have spent an hour faffing about with in Word.
This follows on from a point I made in my post on the democratisation of resource creation. Teachers can now generate bespoke resources for their class, on any topic, not just the Number and Algebra ones we were limited to as recently as a few months ago.
A word of warning on this — and I think this is a point that often gets missed when we talk about AI resource creation. You really do need to be using the latest models. And these come at a cost.
To access Claude’s Opus 4.7, you are looking at £20 a month. And I will be super honest: even when you pay £20 a month, you run into usage limits pretty quickly unless you do your resource creation on weekends or in the evenings.
This can be dead annoying. I have been mid-flow building a worksheet, feeling like I am one prompt away from the perfect output, and then been told I have used all my limits and cannot use it for another three hours. That is a low point.
I pay £75 a month for the Max plan, and for me it is worth the cost. I can produce things in much greater volume than I would by hand. Arguably, I can produce work of higher quality because my time and attention are not on the nitty-gritty; they're on the broader pedagogical aspects. And it is a bit of a hobby for me, so I do not mind paying for it. But I just wanted to be clear that it is difficult to get these high-quality outputs using the free models
Application 2: AI tutors that can finally draw
The second application is potentially more exciting.
If you have been listening to my podcast over the last few weeks, you will know I am doing an AI in education mini-series. One of the things that has come up there is AI tutors. I have discussed it with Adam Boxer, Dan Meyer, Carl Hendrick, and my colleague at Eedi, Bibi Groot, who discussed our work with Google DeepMind on building an AI tutor.
Every AI tutor I have seen has fallen down again when it comes to diagram creation.
Imagine you are interacting with an AI tutor to solve linear equations. The AI is really good — as long as you train it and constrain it — at identifying the misconception you have, then serving you up appropriate, bespoke linear equations to match your need at that moment.
And it can use aspects of variation theory. So you have solved 2x + 1 = 5. What happens if it is 2x – 1 = 5? What if it is 3x – 1 = 5? What if it is 3(x – 1) = 5? You can get AI tutors to do that. And that is super useful for students — scaffolding, spotting patterns, generalisation, all of it.
But because AIs have been rubbish at diagrams, you just could not do that with anything geometric. I have seen attempts. And it was bad. Really bad.
Now you can.
Imagine a student is stuck on the area of a triangle. The AI tutor could now serve up triangles, carefully varied. Just change the base — keep everything else the same. Just rotate the triangle — keep everything else the same. Just change where the labels are placed — keep everything else the same. Just change the units — keep everything else the same.
All of a sudden, students are not just getting a greater volume of practice. They are also getting better practice. The AI is varying these diagrams in the way a skilled human practitioner would.
That excites me for the future. I have not yet seen an AI tutor implement this, but it is only a matter of time. And I think it could elevate the impact of AI tutors on student learning to a different level.
Of course — and I cover this regularly in the podcast series — there are major barriers and objections to AI tutors that this does not magically solve. But the diagram problem was a real ceiling. And that ceiling has just been lifted.
What I have been building
So this is what I have been doing in my spare time when the kids are in bed, and my wife is watching something much more interesting than my laptop screen on the TV.
I have built a new series of resources called Shedloads of Practice. I am working my way through key Geometry and Statistics topics — the very topics that were sparse in my old bundles, for all the reasons above.
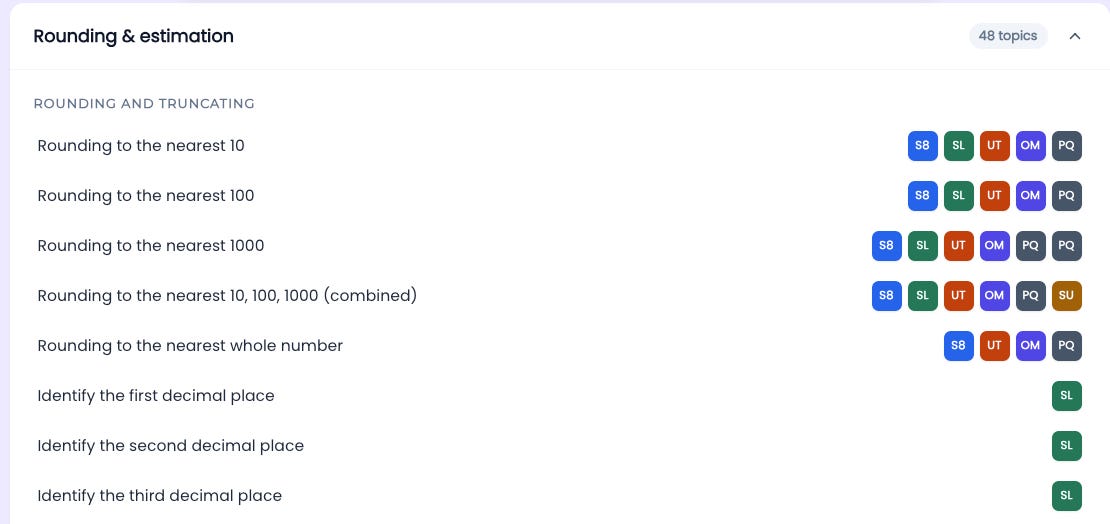
More excitingly, I have restructured my Mr Barton Maths website, and I now have a new Topics page. My plan over the next God-knows-how-long is to create different resource types for each topic in mathematics.
You will find all my Shedloads of Practice resources linked from the topics page, along with some other resource types I have not talked about publicly yet, and which I will discuss in a later newsletter. If you want a sneak preview, just visit the Topics page.
Over to you
As ever, I am super interested in what you are doing with AI and resource creation.
I am thinking of doing an AI teacher-special episode of the podcast, sharing what classroom teachers are doing day-to-day with AI. Not just resource creation, but how AI is saving them time, how it is helping them do their job better, how it is helping with their professional development, how their students are using it, and so on.
So if you want to share any examples of what you have been doing — drop them in the comments. That would make my day.
Right, I am off to see if I can get Claude to draw me a decent circle theorems practice set. Wish me luck.
Have a great day, and thanks for reading.
Craig
Hi Craig, I have been following your work on AI with interest. Like you, I enjoy working with Claude, as well as some other tools. I agree about the democratisation of creation that AI is allowing for teachers. The resource creation is great, but the other side which I have been exploring in more detail is all the tools for explanation and example that people have been building. I think the scope here to support teachers with dynamic resources that provide more than PowerPoint and are less intimidating than complex geometry and graphing packages can be is huge.
I have started building some of my own tools at https://sensemake.uk , but more importantly I am working to build an index of all the things that people are creating and freely sharing so that teachers can find them (and find them again when they forget where they found them). It's a work in progress, but completely free. The site is at https://mathsindex.uk and already has a number of tools linked, including some of your excellent creations (I hope you don't mind). Tim
Hi Craig, I'm loving this... but one thing that seems to be missing almost everywhere in maths webiste/ systems is the idea of mixed practice... I'm just nearly ready to publish a long in production blog post on the neurobiochemistry of how we learn and its implications. And one thing that struck me from my deep dive into this is that a high level of repetition of similar problems may actually start degrading our long-term storage of that method. So repeating similar problems should not be more than 5 in a row, and even in that there should be variation. What we need is mixed practice sets of questions from the last 5-10 topics. I am struggling to find tools to help with that. AI should be ideally placed to take input from a curriculum record and then dynamically produce mixed questions sets.... to allow susfficent desriabel diffiuculty, appropriate method selection skills etc. ideally this scales donw to the individual, but perhaps at least group level ones could be achievable.